Previous story
← Introducing Groups: A New Way to Manage Your UsersNext story
Gartner Named ezeep “Cool Vendor” →
Cloud Printing with Native Printer Drivers
Cloud Printing with Native Printer Drivers
Jun 22, 2020 2:00:00 AM
2
min read
Print Later – Print and Collect Print Jobs Later
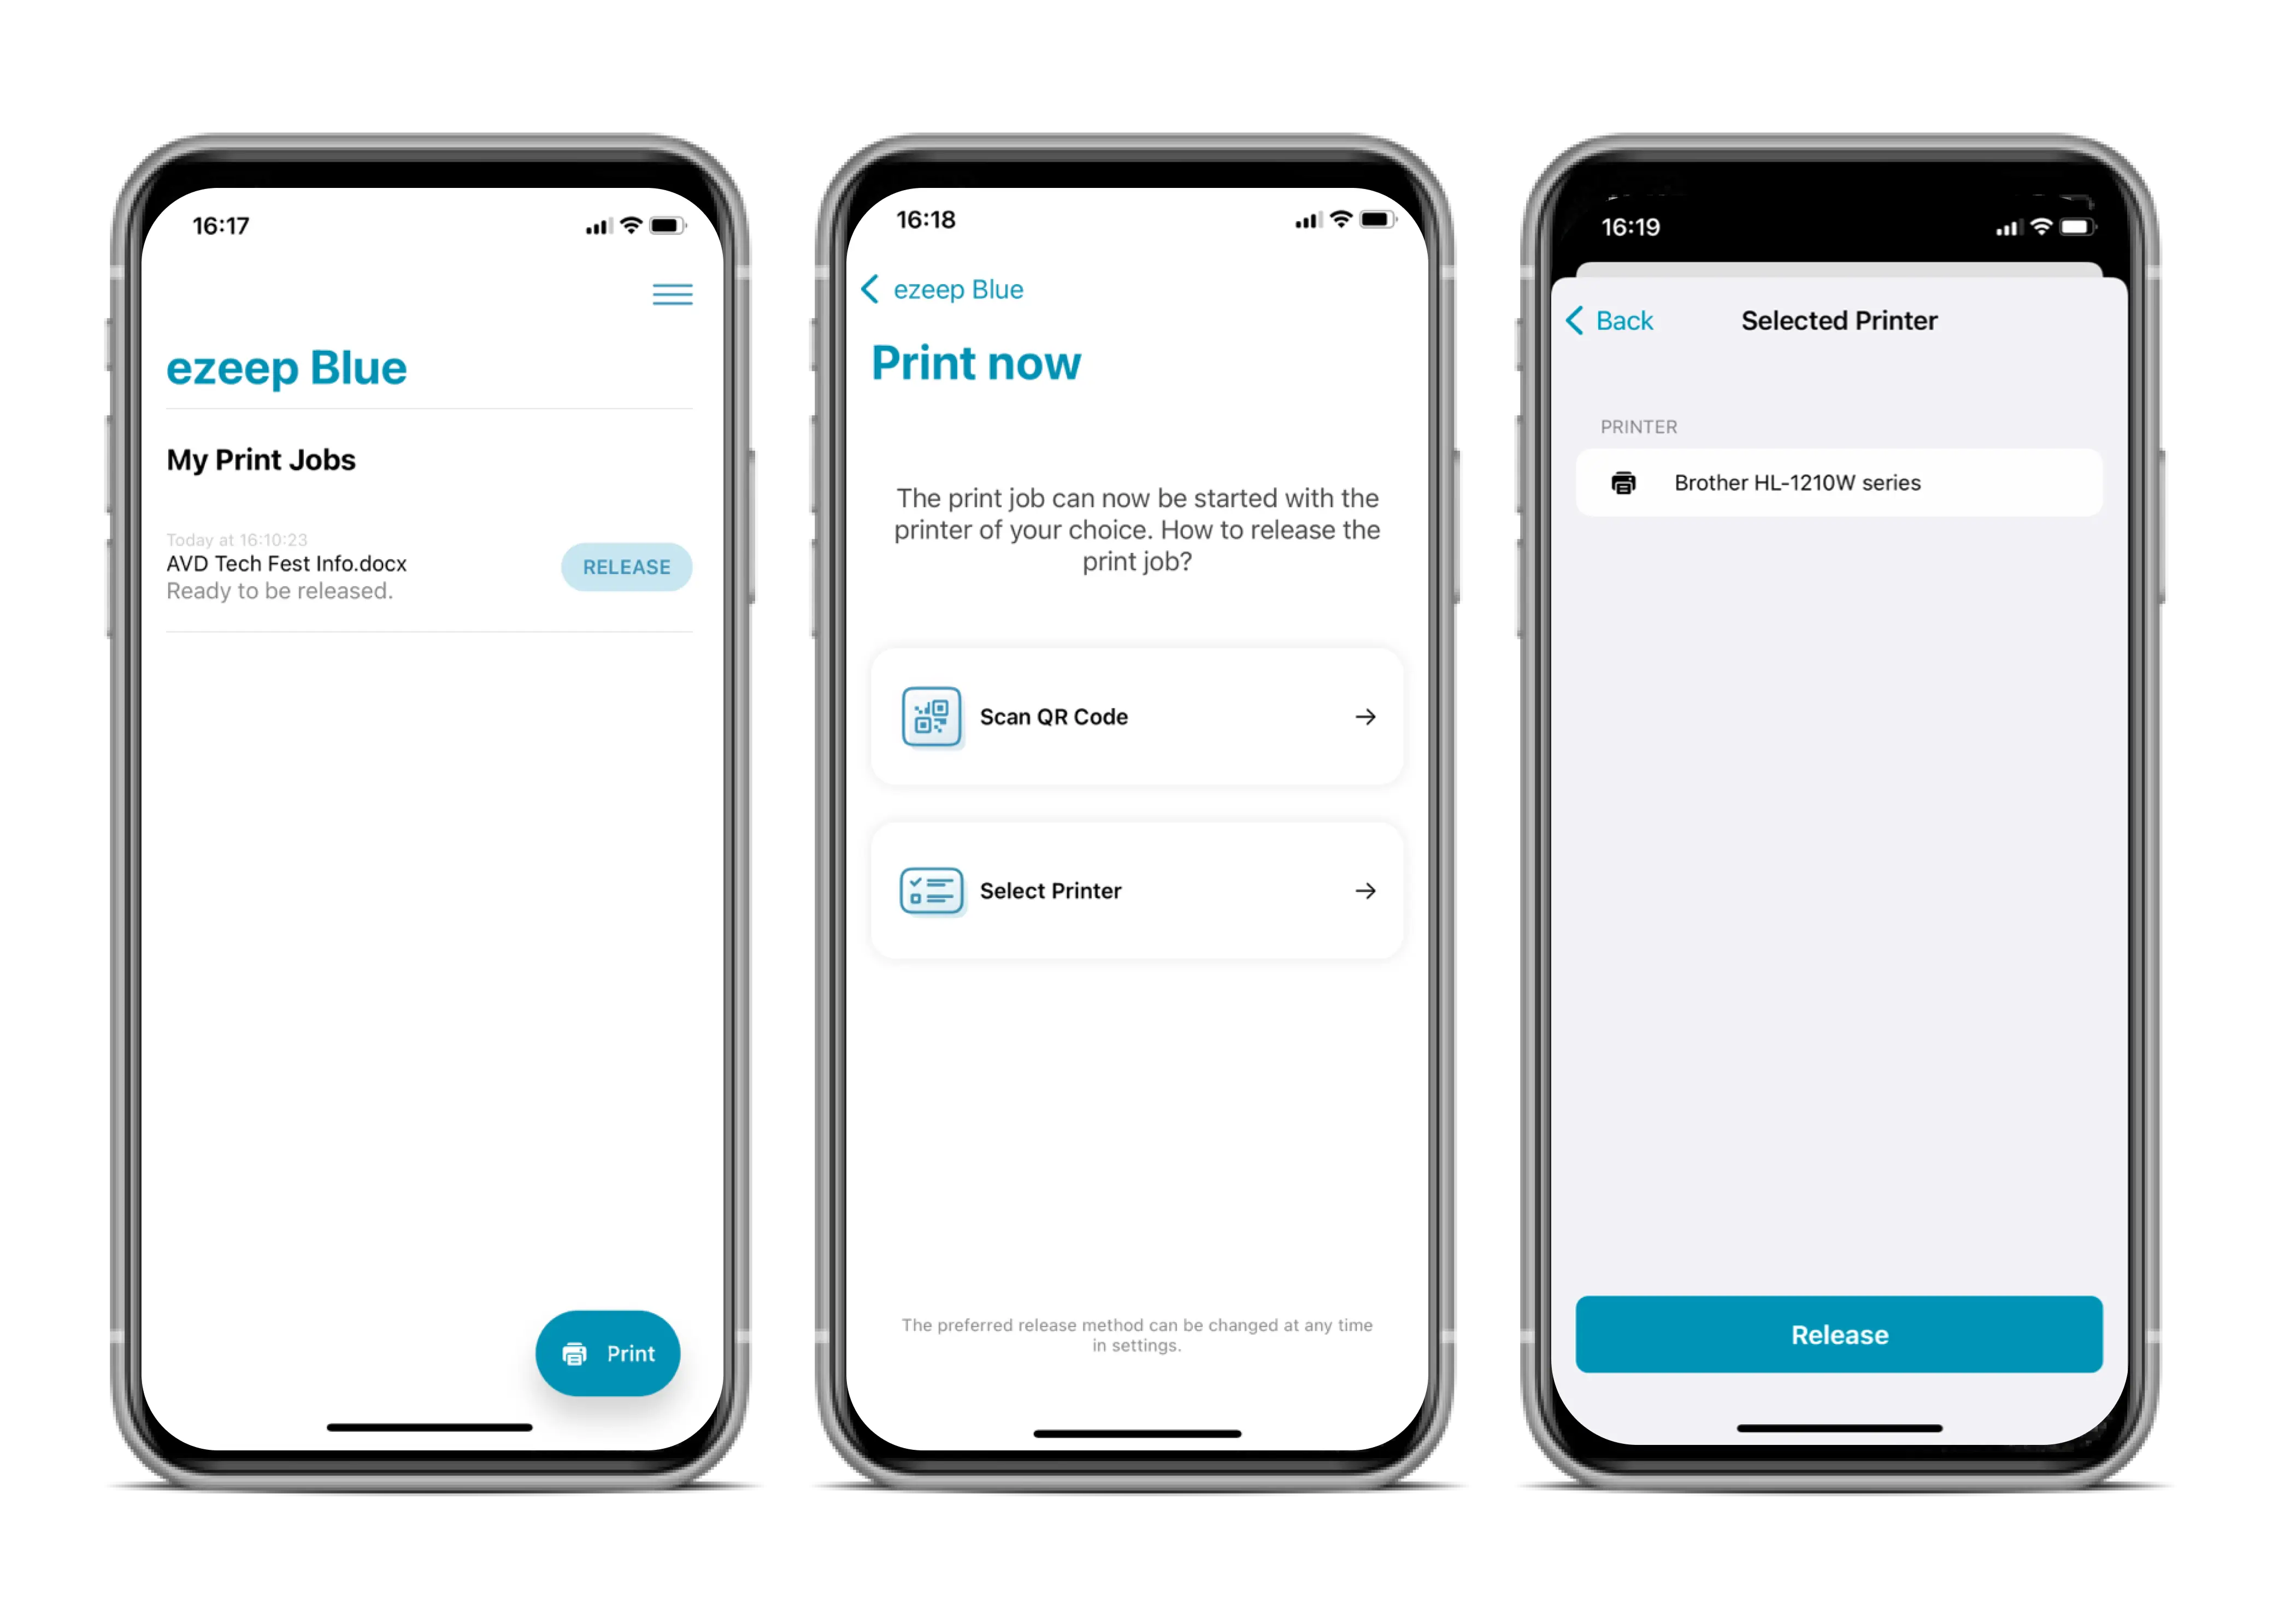
Print Later – Print and Collect Print Jobs Later
Aug 5, 2022 2:00:00 AM
1
min read
Introducing Groups: A New Way to Manage Your Users
![Introducing Groups: A New Way to Manage Your Users]()
Introducing Groups: A New Way to Manage Your Users
Oct 17, 2013 2:00:00 AM
2
min read
No Comments Yet
Let us know what you think